CANvas: Scale, Merge & Downsample Your CAN Bus Data
So, you've logged your raw CAN bus data with the CLX000.
But now what?
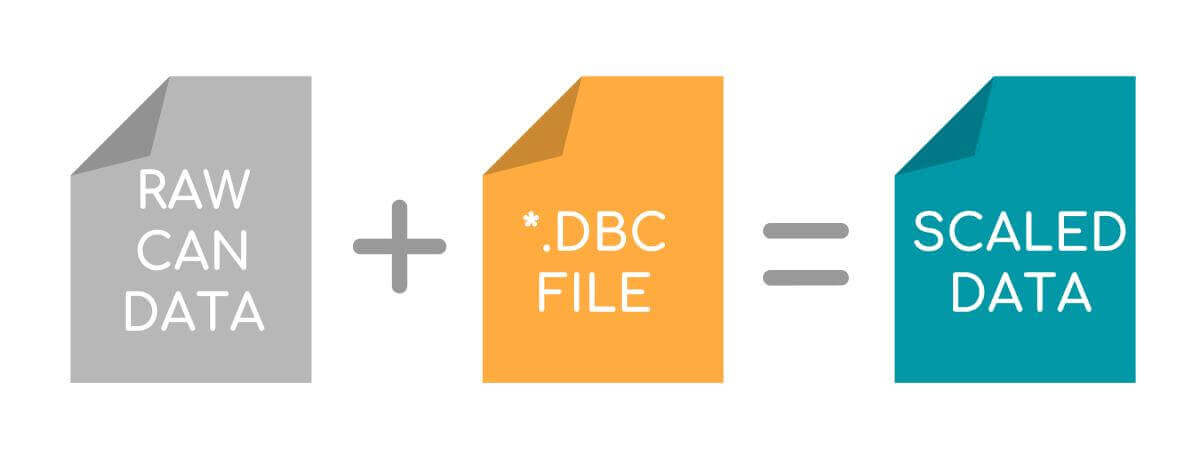
To get any insights from your truck, car, bus or other CAN bus application, you'll need to convert the raw CAN bus data into scaled engineering values.
Luckily, this is easily done with our free software CANvas!
Simply set up your conversion rules, load your log files and click convert!
In this article, we go through step-by-step the following CANvas features:
- How to convert your data into human-readable format with a *.DBC file
- How to easily merge multiple raw CAN log files into one output file
- How to dynamically split a merged output file into chunks of a max #rows
- How to downsample your data into e.g. 5-min frequency observations

|
For a quick intro, check out our 1.5 min video above showing how the features work directly in CANvas. |

BASICS: SCALING PARAMETERS AND *.DBC FILES
Before the guide, let's spend a few seconds on the basics:
To convert your raw CAN bus data, you need to know the scaling parameters - also known as conversion rules.
In simplified terms, a CAN message is comprised of an Identifier and 8 bytes (64 bit) of data, which may include multiple Signals.
To interpret a given CAN Signal, you need to know the Start Bit Position (e.g. 1), Bit Length (e.g. 16), Scaling Factor (e.g. 0.125), Offset (e.g. 0) - and ideally Name (e.g. Vehicle Speed), unit (e.g. RPM), Min (e.g. 0), Max (e.g. 8,031.875) etc.
Check out our simple intro to SAE J1939 for more details on this breakdown into CAN bus Signals.
The most common standard file format for this type of information is *.DBC files, which is supported by CANvas.
But what if you do not have the scaling parameter info?
In that case, you can try to get it from the original equipment manufacturer (OEM).
If that fails, you may be able to reverse engineer or "hack" the CAN bus for this information. In practice this is often done by streaming the raw CAN data and analyzing it for patterns.
Our free CANvas Wireshark plugin contains great CAN sniffing / hacking tools - but it's an advanced exercise.
GUIDE: SCALE YOUR RAW CAN BUS DATA WITH *.DBC FILES
We'll assume below that you have a *.DBC file ready.
To get started, open CANvas and click 'CONVERT DATA'.
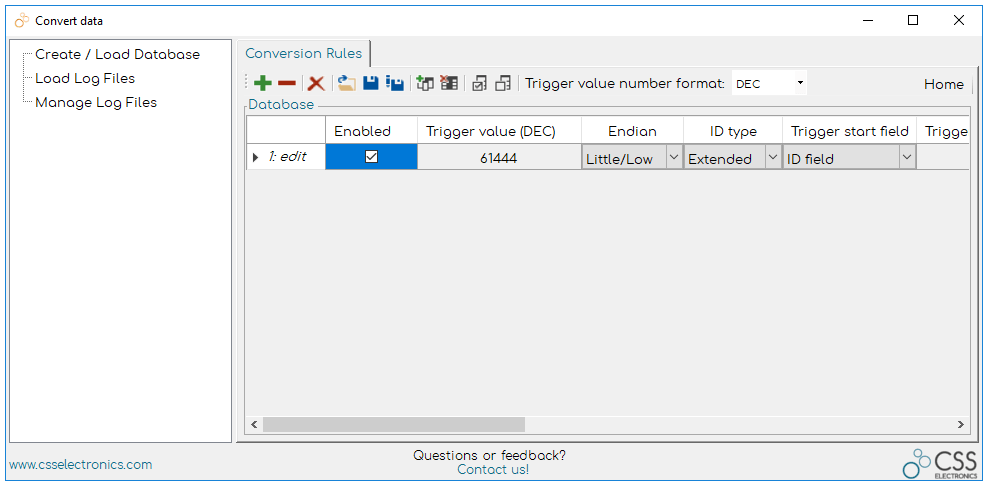
Start by loading your *.DBC file and selecting what fields to include as columns.
If you choose to only include e.g. 1 conversion rule (say, RPM), only this data will be included in the output file.
In other words, the conversion rule tab acts as a convenient filtration of what data will carry through to your output.
Next, go to 'Load Log Files', hit browse and select the log file(s) you want to convert.
Finally, go to "Manage Log Files' and select the 'SCALED ENGINEERING VALUES' option.
Click the 'Output'
tab and then click the green 'Play' button to convert.
You'll now have an output file with human-readable data - ready for loading into e.g, Excel for analysis and insight.
That's it!
GUIDE: MERGE & DOWNSAMPLE YOUR CAN BUS DATA
CANvas provides a number of great options for customizing your conversion.
Click 'Options' in the 'Output' tab to specify basic things like save path or real-time clock output format.
But there are far more powerful options available as well:
1# CAN BUS LOG FILE MERGING
In the Options, you can enable Log File Merging.
This is a really cool feature:
Imagine you set up your logger to split files in 100 MB chunks - and that you log data from e.g. 10 trucks.
Over a month, this can lead to tons of individual log files!
How do you manage this?
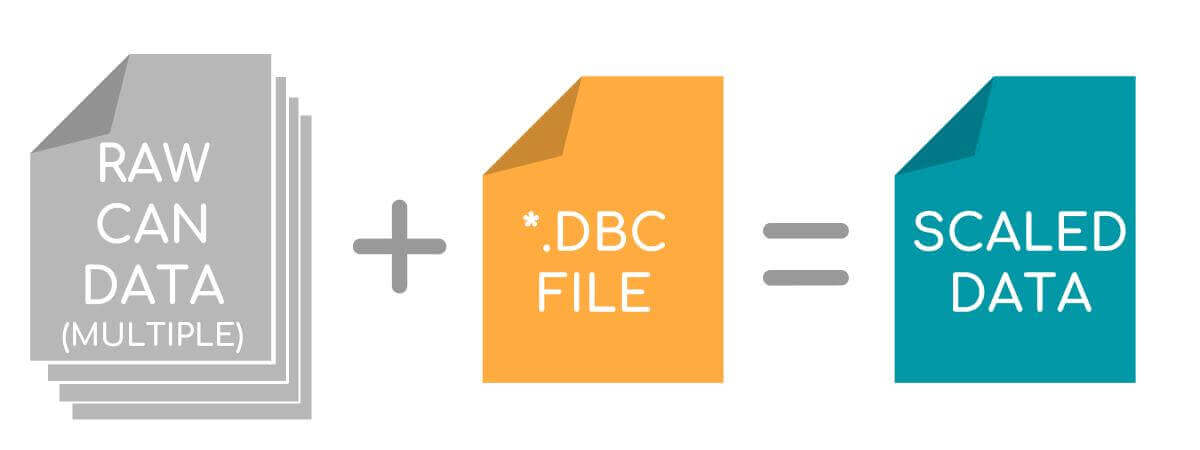
Easy:
With CANvas, you just load all your log files and enable Log File Merging to compile it all into one big output file.
To distinguish e.g. LoggerIDs (i.e. what data from what truck), simply include the ID as an output column via the options.
With e.g. Excel pivots it's then easy to filter your data for fast analysis!
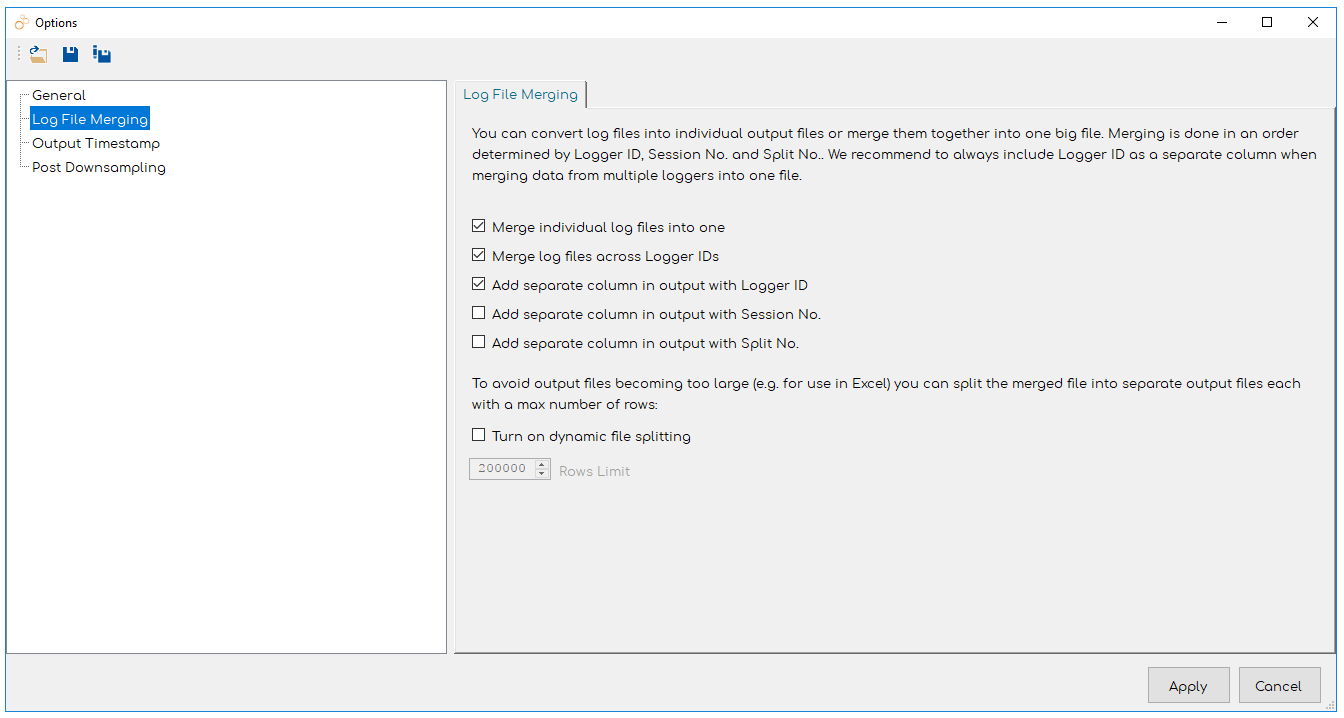
But what if this creates a massive file that is way too heavy for e.g. Excel?
In that case, just enable 'Dynamic File Splitting'. This allows you to specify a max #rows in the final output file, automatically breaking the merged file into chunks sized as you see fit.
E.g. if you want to limit a file to a max of 20,000 rows, simply enter this in the 'Rows limit' - and your merged "mega file" will be output in blocks of 20,000 rows each.
2# CAN BUS LOG FILE DOWNSAMPLING
Downsampling is another great feature:
For some analyses you need the high frequency - but for others you just want to look at e.g. a daily or hourly trend perspective.
Example: Imagine you've set up your CL3000 to store high frequency data from a tractor over several months and you've now got 16 GB of data.
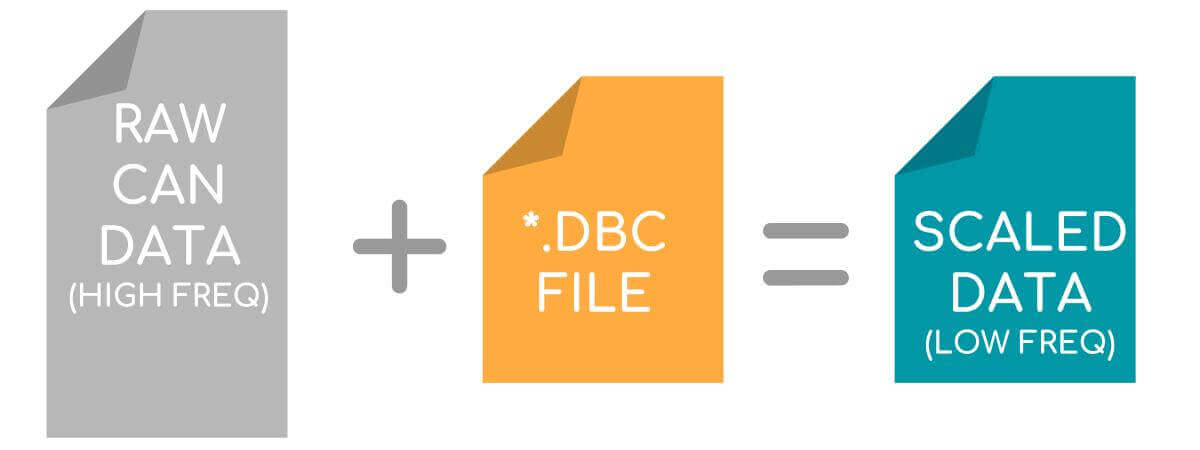
For your analysis you may just need the long-term trend data - and 16 GB of high frequency data can be impractical.
By enabling Downsampling in your data conversion, you can aggregate your CAN data to a specified frequency (in miliseconds).
This lets you turn super frequent data into one observation per Signal per interval (e.g. 1 observation per hour per Signal).
But wait, there's more!
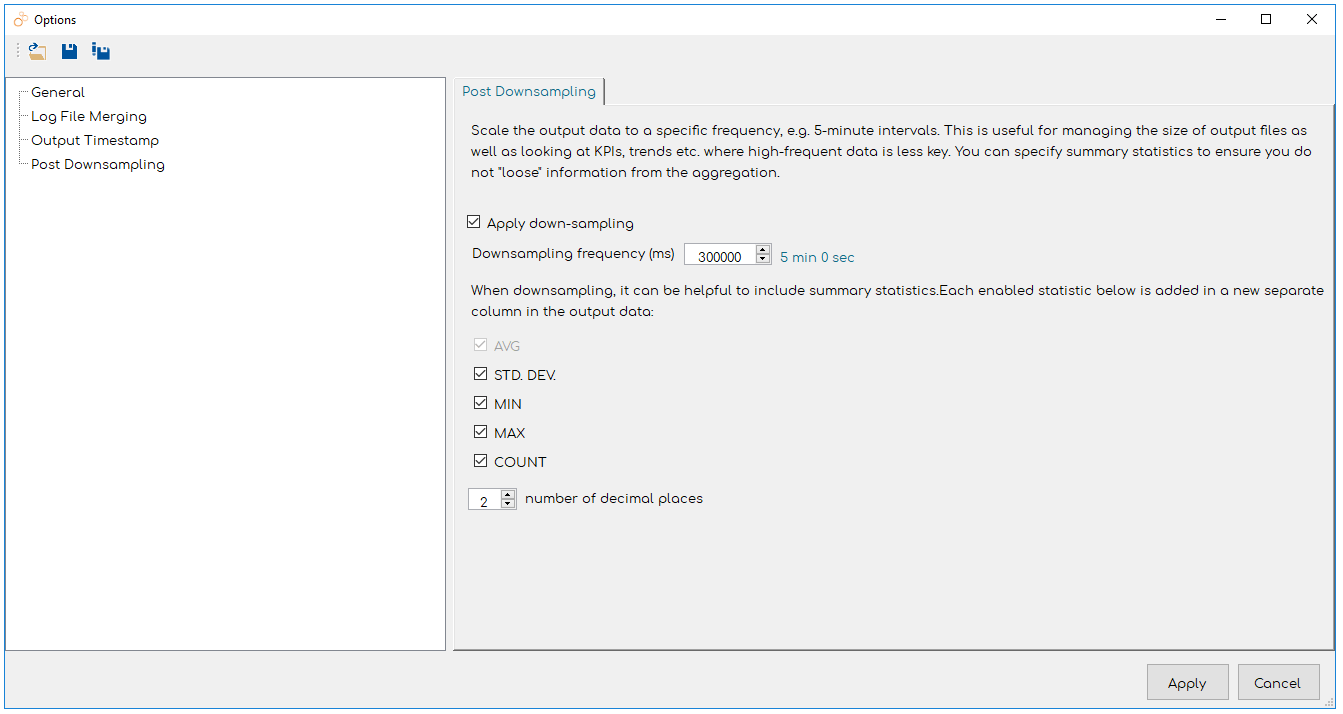
The average may not be enough for your analysis.
Maybe you also need the standard deviation, min, max or observation count per interval.
No problem - you can just add this information as separate columns in your output file!
Together, Log File Merging and Downsampling provide a powerful combination:
They allow you in a few clicks to go from tons of log files and data - to a single, optimized output file with just the data you need.
Sliced and diced, ready to provide you with insight!
3# Excel & Pivot Friendly Timestamp & Header Format (NEW)
We've recently made it a lot easier to work with the output files in various 3rd party programs - incl. e.g. Excel and Pivot tables.
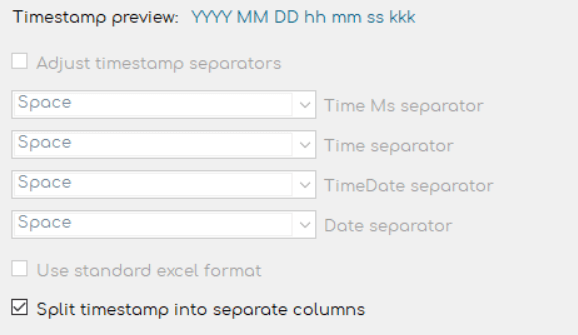
In particular, we've added a "timestamp split" feature that allows you to split each part of
the timestamp in separate columns:
I.e. one column for each of the following: YYYY, MM, DD, HH, MM,
SS, kkk.
This makes the data a lot easier to utilize in Excel Pivot tables and many other programs.
Further, by excluding the info header from the output file, you'll be able to load the data directly into an Excel PowerPivot.
This lets you manipulate data sets far larger than what Excel normally handles (we've tested with 20 GB+ files).
4# Customize Output File Column Structure (NEW)
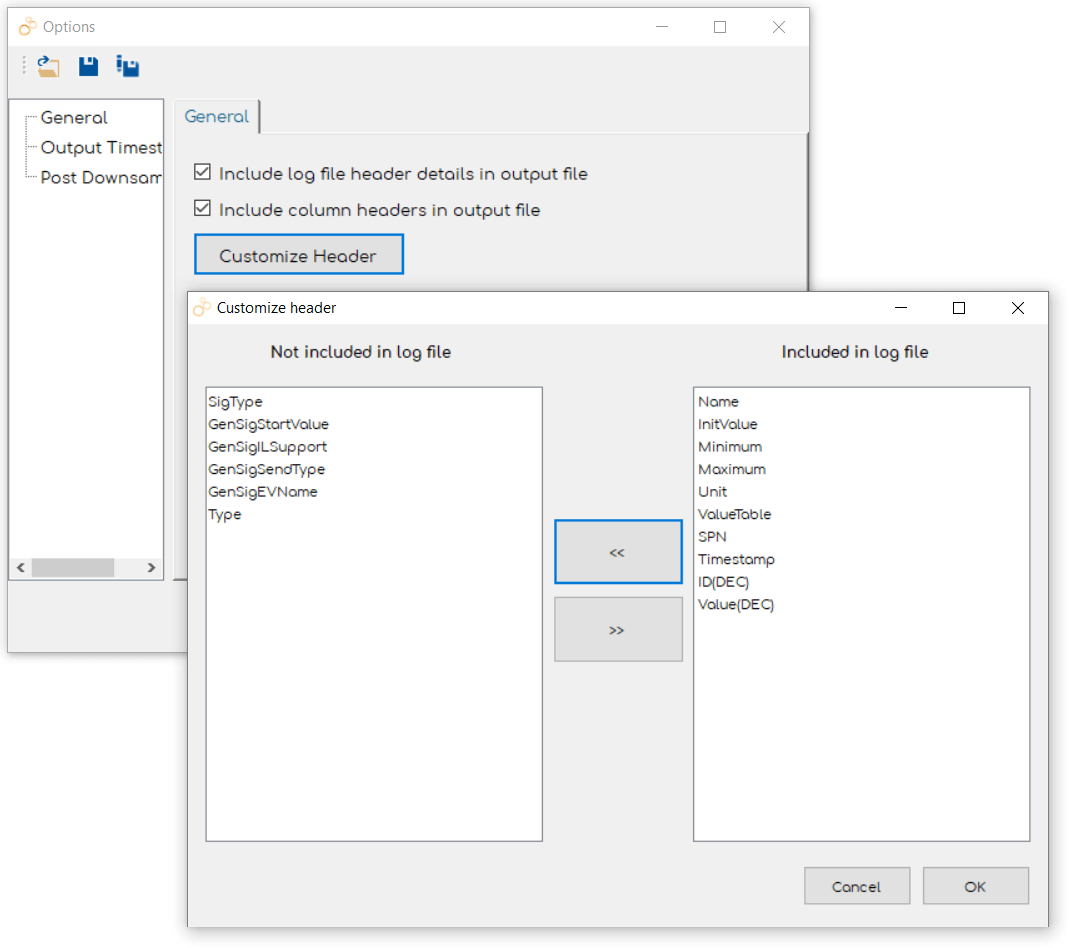
Often you'll want to exclude certain columns from your final output to compress or simplify.
Now we've made this really easy with our customized header selection!
Simply select the columns in Output Settings you wish to exclude and move them - and that's it:
5# Create Accumulating Output Datasets (NEW)
If you're constantly getting new, small log files (e.g. from a fleet of FTP pushing WiFi CL3000 units), you'll want an easy way to combine them into a dataset as they arrive on your PC or cloud server.
Luckily, we've now got you covered:
In CANvas you can now specify to save an output file onto an existing output file, which will "append" it to the end of the file.
In this way, you can e.g. enable CANvas "auto conversion" and continuously expand your output database.
In turn, this can then be referenced by e.g. SQL or an Excel PowerPivot.
This is ideal e.g. if you're doing frequent updates of dashboards and always need the freshest data together with historical data.
Note that the output of course has to be structured consistently when using this method.

Closing Remarks
For all the above features, you can save your option settings and load them next time you work.
Further, you can also use Log File Merging if you use CANvas to re-transform your raw CLX000 data files into e.g. Vector's CANalyzer or PEAK's PCAN-View formats.
We hope you like these great options in CANvas - if you've got ideas for new features, please let us know!
To learn more about the CLX000 series, click here.

