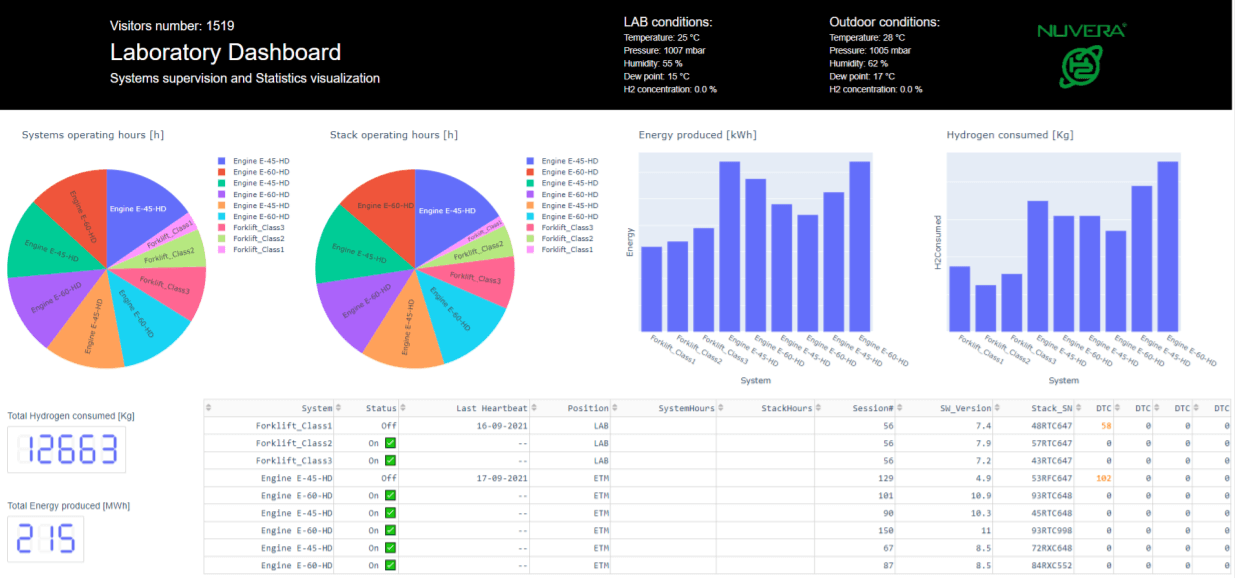
Monitoring Fuel Cells via CAN Bus Dashboard [Dash by Plotly]
Case Studies / Nuvera Fuel Cells

Nuvera Fuel Cells
Nuvera manufactures heavy-duty, zero-emission engines for mobility applications industrial vehicles and other transportation markets.
What problem did you solve?
In our laboratory we have several hydrogen fuel cell systems running 24 hours every day. In these systems there is a CAN bus that drives all critical components. Through this bus it is possible to acquire a lot of data regarding the system operation and performance. We need all this data to be extracted and elaborated for reliability and continuous improvement of our products.
How did you solve it?
A CANedge2 is installed on every fuel cell system in our lab. The data is recorded into log files (1 hour chunks), which are automatically uploaded and stored on a local self-hosted MinIO S3 server.
On this server, the data is processed automatically every day to visualize graphs showing systems operation. The data elaboration is made through a custom script that use the Python API to manage files from the CAN bus data loggers. In addition a customized dashboard is generated to provide a quick view of key parameters of our systems. This dashboard is made using the Dash Plotly library.
"The CANedge2 is a very affordable and reliable solution for acquiring, elaborating and visualizing CAN bus data"

What benefit has this led to?
Thanks to the Python-based automation of the data visualization (through graphs and dashboards), this project allows us to save a lot of time in the data elaboration process.
Why did you choose the CANedge2?
I chose this logger mainly for the data format [MF4] which is an automotive standard and allows for easy data manipulation through scripts.
— Diego Mauri, Test & Reliability Engineer, Nuvera Fuel Cells
Ready to log your CAN bus data?
Get your CAN logger today!