Construction Telematics with Grafana Dashboards & Data Lakes
Case Studies / Steelwrist
Steelwrist
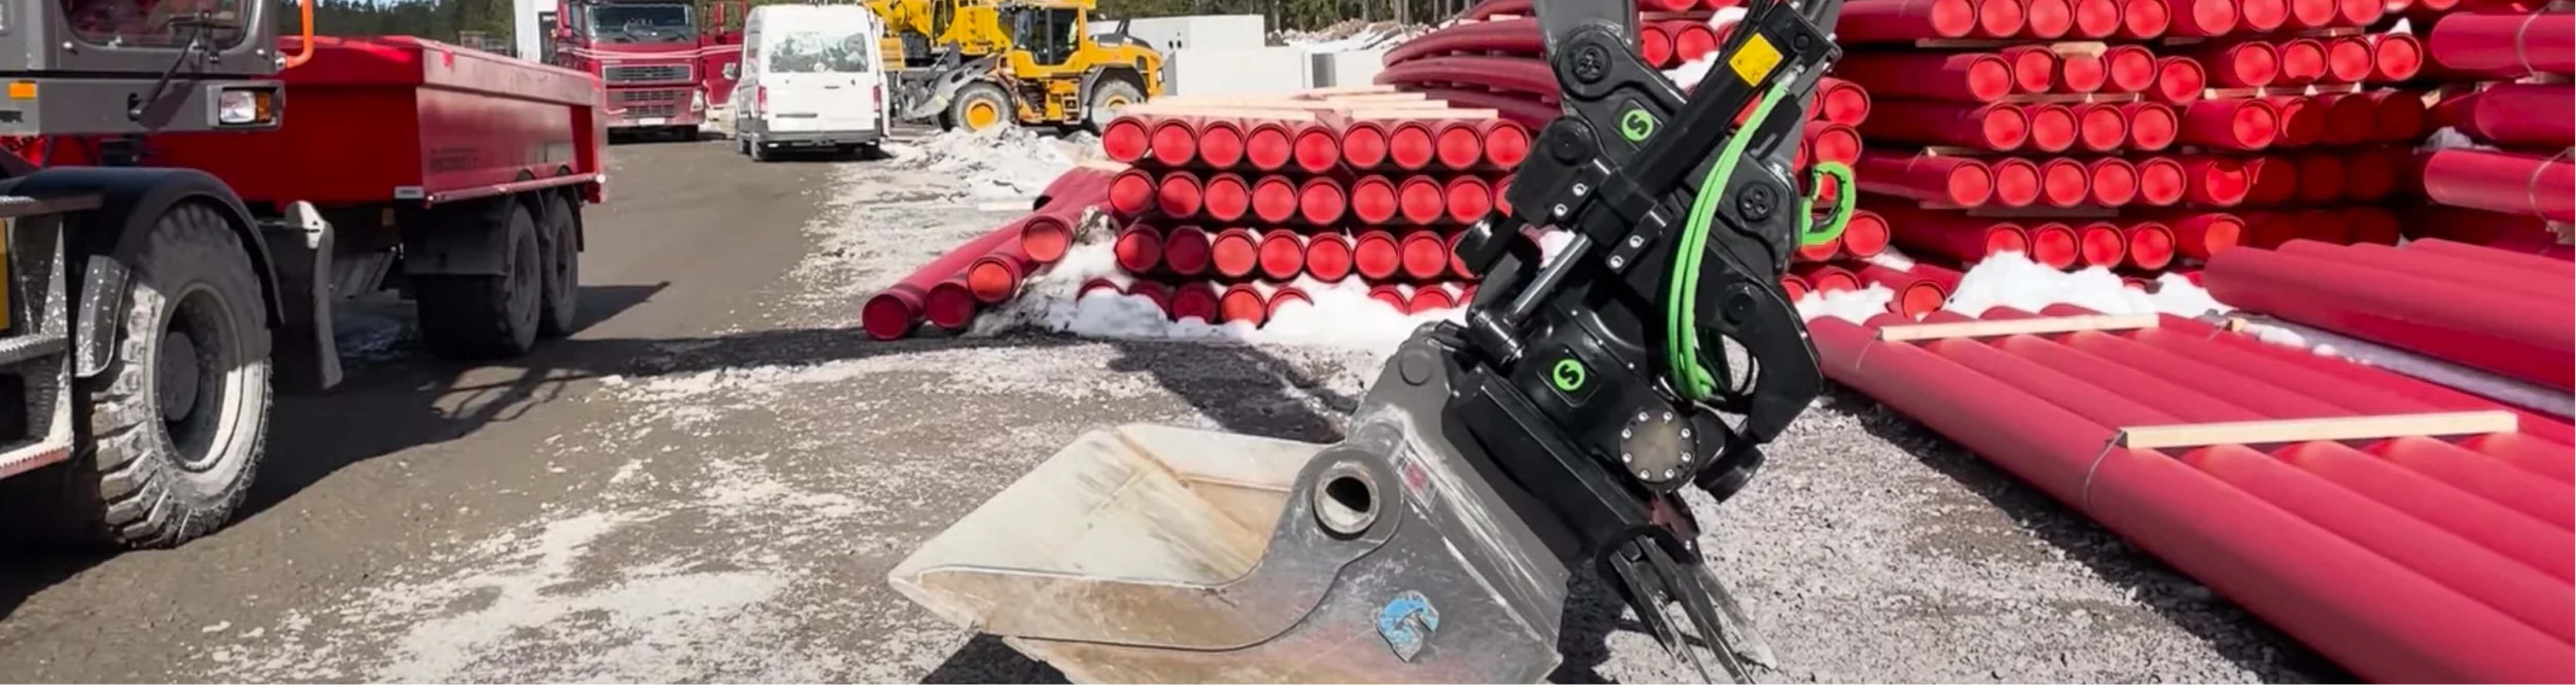
Steelwrist is a Swedish company specializing in advanced tiltrotators, quick couplers and work tools for excavators. Their products enhance the flexibility and efficiency of construction equipment.
What problem did you solve?
During the development phase of our new sensor-based indication system, one of our biggest challenges was ensuring that our system met our high-set requirements. Without logging, we relied on lab tests and user feedback, which limited our understanding.
The indication system of focus is called LockSense and is included in our new, third-generation Tiltrotator (XTR20) - a product that greatly enhances the efficiency of excavators.
How did you solve it?
By deploying field-based CAN logging, we could continuously monitor our system - instantly seeing the impact of our design choices. When the system behaved unexpectedly, the CANedge loggers allowed us to pinpoint issues precisely, enabling early resolution without guesswork.
We have both CANedge2 and CANedge3 devices, which we can easily plug into our customer's machinery. Using the Grafana-Athena integration, we continuously process the collected data. This setup allows us to troubleshoot in near real-time by simply connecting a CANedge to a machine experiencing issues, immediately starting effective troubleshooting based on actual system data.
Today, we work with two types of Grafana-Athena dashboards. Our device-specific dashboards enable us to visualize detailed data from every single device in our fleet. Further, our trip summary dashboard lets us visualize data across all devices and trips - enabling us to quickly filter for specific trips of interest based on custom parameter aggregations. Both are deployed based on the CANedge step-by-step guides.


Device specific Grafana dashboards enable deep-dive analyses

Trip summary dashboards provide overviews across devices and trips
"The CANedge is a small, easy-to-install device that enables efficient and reliable data logging - greatly enhancing system diagnostics and product insights"
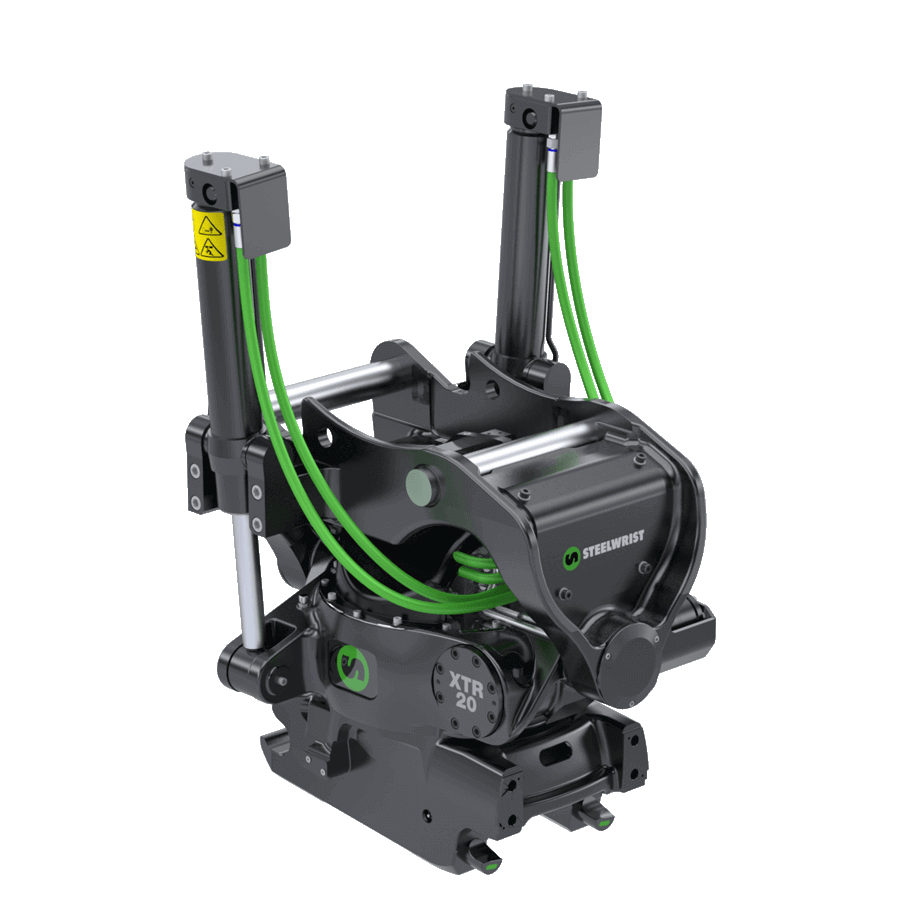
The Steelwrist XTR20 tiltrotator
What benefit has this led to?
Logging has transformed our understanding of our system's behavior in the field and how our customers interact with our products. We can identify and address unwanted behavior, significantly reducing bugs that are hard to detect in lab settings. Additionally, insights into customer usage have led to enhancements in the user experience. This data-driven approach has also helped us make wiser design decisions, ultimately leading to superior products for our customers.
Why did you choose the CANedge?
We chose the CANedge for its simplicity in data logging and minimal requirement for prior CAN logging knowledge. The extensive documentation and guides on CSS Electronic's website, together with practical case studies, helped us visualize our implementation and possible benefits. The excellent support from CSS Electronics, with quick and informative responses, has also been highly appreciated.
— Axel Sundkvist, R&D, Steelwrist
Ready to create your own CAN dashboards?
Get your CANedge today!


