Power BI Dashboards + CAN Bus Data [Synapse | Azure]

Need to visualize your CAN bus data in Power BI?
The CANedge lets you record 2 x CAN/LIN to an SD (e.g. from vehicles/machines) - and push it to your own server via WiFi/LTE.
Here we explain how you can collect raw data to your Azure Blob Storage container, decode it with Azure Functions - and analyse it via custom Power BI dashboards/reports.
Tip: If you prefer Grafana dashboards, see also our intros on Grafana-Athena, Grafana-BigQuery or Grafana-Synapse.
Learn more below!


 CUSTOMIZABLE
Visualize e.g. vehicle/machine data in custom and interactive reports
 DATA LAKE
Parquet data lake stored in Azure container - with database-like speed (but 95%+ cheaper)
 YEARS TO MS
Browse through years of data - and zoom in to the exact ms of interest
 SCALABLE
Seamlessly scale from 1 to 1000+ CANedge devices - and from MBs to TBs of data
 NATIVE
Use Power BI for your CAN/LIN data reports to enable a seamless Azure-native experience
Get our Power BI Desktop template - and try the deployment with our sample data!
PowerBI-Synapse: How does the integration work?
Below we briefly explain a typical PowerBI-Synapse setup:
- A CANedge uploads raw CAN/LIN data to your 'input container'
- When a log file is uploaded it triggers an Azure Function
- The Azure Function DBC decodes the data to Parquet files
- The Parquet files are written to an 'output container'
- Power BI visualizes this 'data lake' via Azure Synapse
This can be deployed in <15 minutes - with zero coding.
Tip: This can also help enable more advanced architectures.

Below we provide details on each element of the setup.
Tip: You may also try our step-by-step integration guide with free MF4/DBC sample data now.
Uploading CANedge data to Azure input container
The CANedge lets you upload data to any S3 bucket, incl. e.g. natively Amazon, Google Cloud, MinIO and more. Azure does not have a native S3 interface, but you can set up an S3 gateway via a service from 'Flexify'. This enables seamless integration of your CANedge with your Azure Blob Storage container. We describe how to set this up in our CANedge Intro.
Azure Function automation
Azure Functions help automate DBC decoding of new data:
- The Azure Function runs when a new log file is uploaded
- It loads DBC files from your input container to decode the raw CAN/LIN data (using our MF4 decoders)
- The resulting Parquet files are added to an output container (Data Lake Gen2)
- Azure Functions are serverless - you only pay when a log file is processed
- They are also highly scalable, from 1 device to 1000+ devices
- All data processing is done automatically (and instantly) upon upload
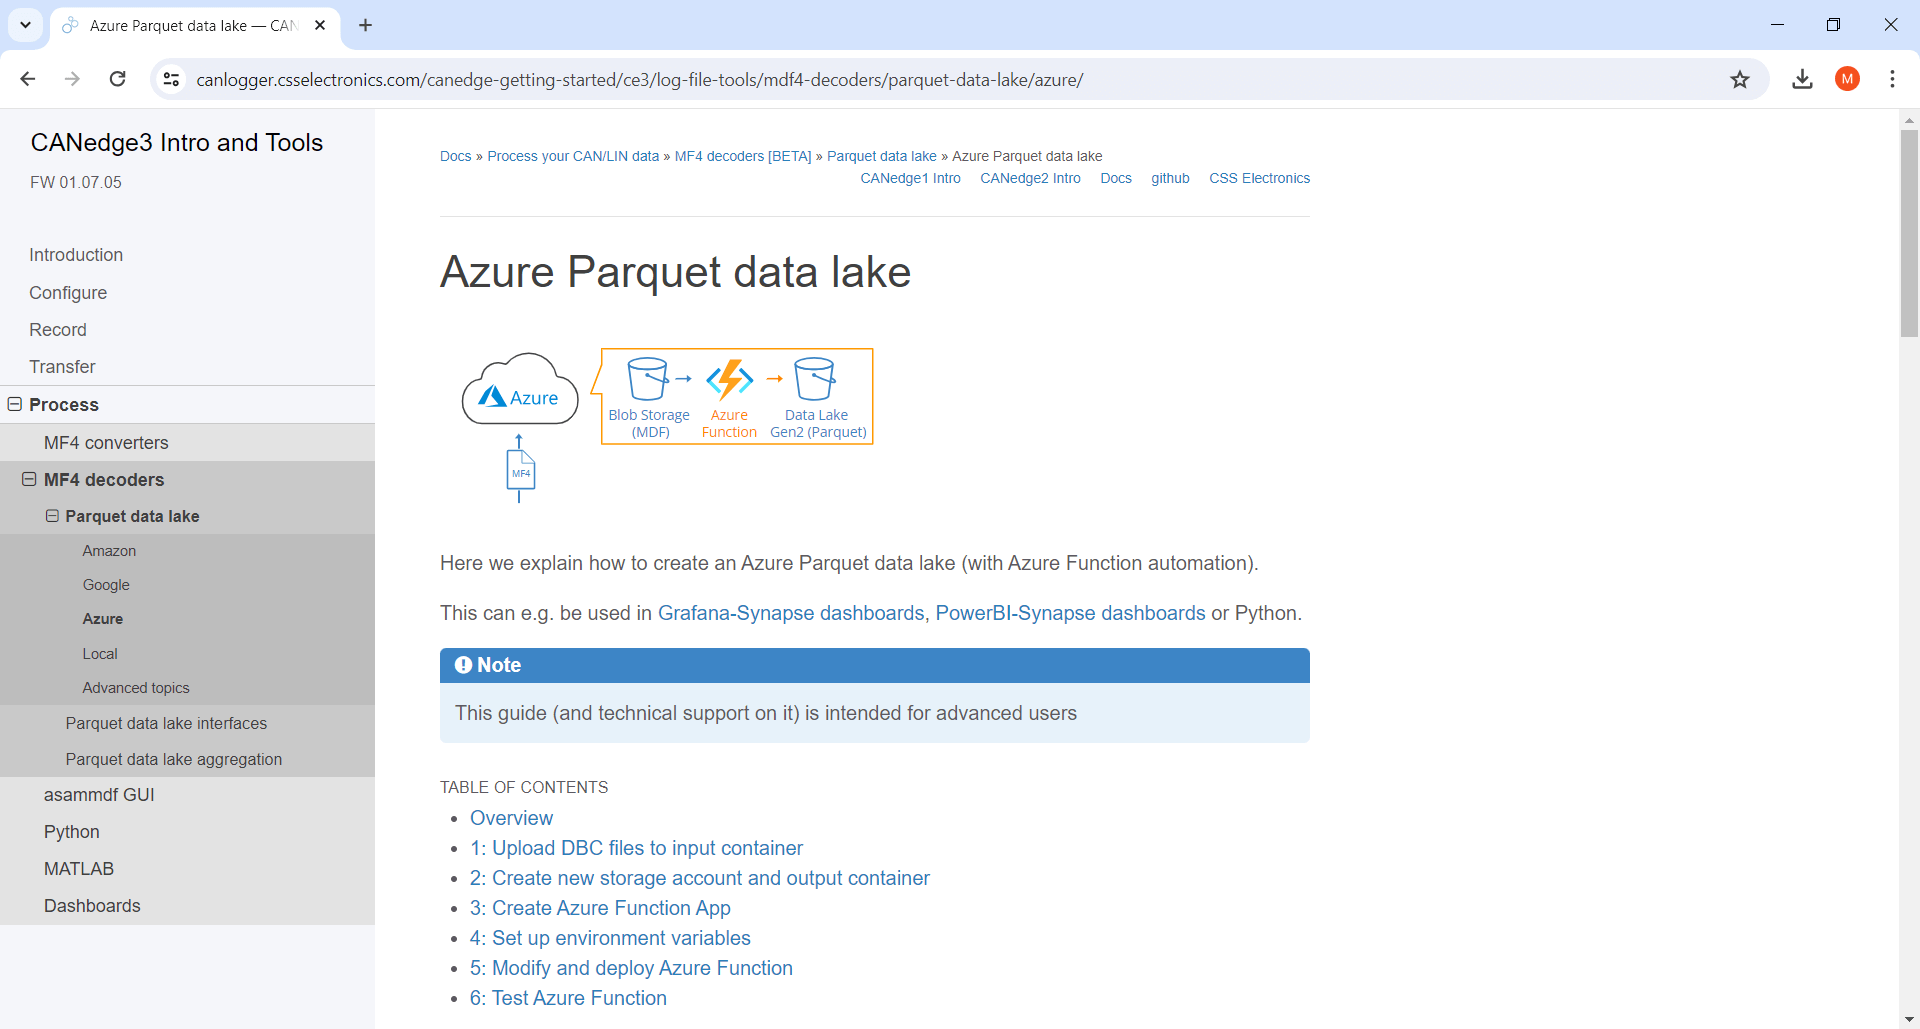
Output container Parquet data lake
The Data Lake Gen2 container stores your decoded data as a 'Parquet data lake':
- The data lake consists of structured Parquet files
- Parquet files are grouped by device, CAN message and year/month/day
- As a result, the data lake is compact and highly efficient
- The data lake is multi-purpose and can be used directly in e.g. Python/MATLAB
- Data lake storage is 95%+ cheaper than using a database
Example: InfluxDB Cloud storage cost is ~1.44$/GB/month vs. Azure Data Lake Gen2 storage cost of ~0.019$/GB/month.
Azure Synapse interface
Power BI can visualize your Parquet data lake via Azure Synapse:
- Synapse provides a simple SQL interface to Parquet data lakes stored in Azure containers
- Further, it can extract results from GBs of data in seconds via parallelization
- Synapse is serverless - you only pay for the data scanned as a result of Power BI queries
- The cost of using Synapse is extremely low at ~5$/TB (i.e. 1-10$/year for most use cases)
See also our Grafana-Athena intro for more details on why we recommend to use Parquet data lakes as the data source.
The CANedge2/CANedge3 enables you to upload log files to your own server (self-hosted or cloud) - including Amazon, Google and Azure cloud. Dashboard visualization and Parquet data lakes are core tools for enabling CAN telematics at scale - and we therefore provide step-by-step integration guides for deploying Grafana dashboards for the top 3 clouds.
Note that you can leverage the Athena and BigQuery deployments to integrate with Power BI as well - e.g. via ODBC drivers.
Below we briefly outline the three integrations:
Grafana-Athena: Most of our users connect their CANedge2/CANedge3 to Amazon S3, which is our default recommended cloud. Here, the Grafana-Athena integration can be used. It offers the simplest deployment, widest set of functionality (e.g. automated trip summary aggregation) and most efficient use of e.g. date partitioning. Data is uploaded to S3, automatically DBC decoded by a Lambda function and output to a Parquet data lake stored in another S3 bucket. This data lake is then queried via the Amazon Athena SQL interface - e.g. by Grafana.
Grafana-BigQuery: Google Cloud offers a nearly identical experience to Amazon as it provides a native 'S3 interoperability' functionality. Further, the Grafana-BigQuery dashboard integration is nearly 1:1 identical to Grafana-Athena. Uploaded data is automatically DBC decoded via Azure Functions and output to a Parquet data lake stored in another bucket. This data lake is then queried via the BigQuery SQL interface - e.g. by Grafana.
Grafana-Synapse: Azure does not provide a native S3 interface, but you can deploy an 'S3 gateway' (Flexify) to enable the CANedge to upload data to your Azure Blob Storage container. Uploaded data is automatically DBC decoded via Azure Functions and output to a Parquet data lake stored in another container. This data lake is then queried via the Synapse SQL interface. The data can then be visualized in Grafana using the Microsoft SQL Server data source.
Set up your own Power BI report in <15 min
Use our step-by-step guide to set up your Azure data lake and PowerBI-Synapse dashboard in minutes!
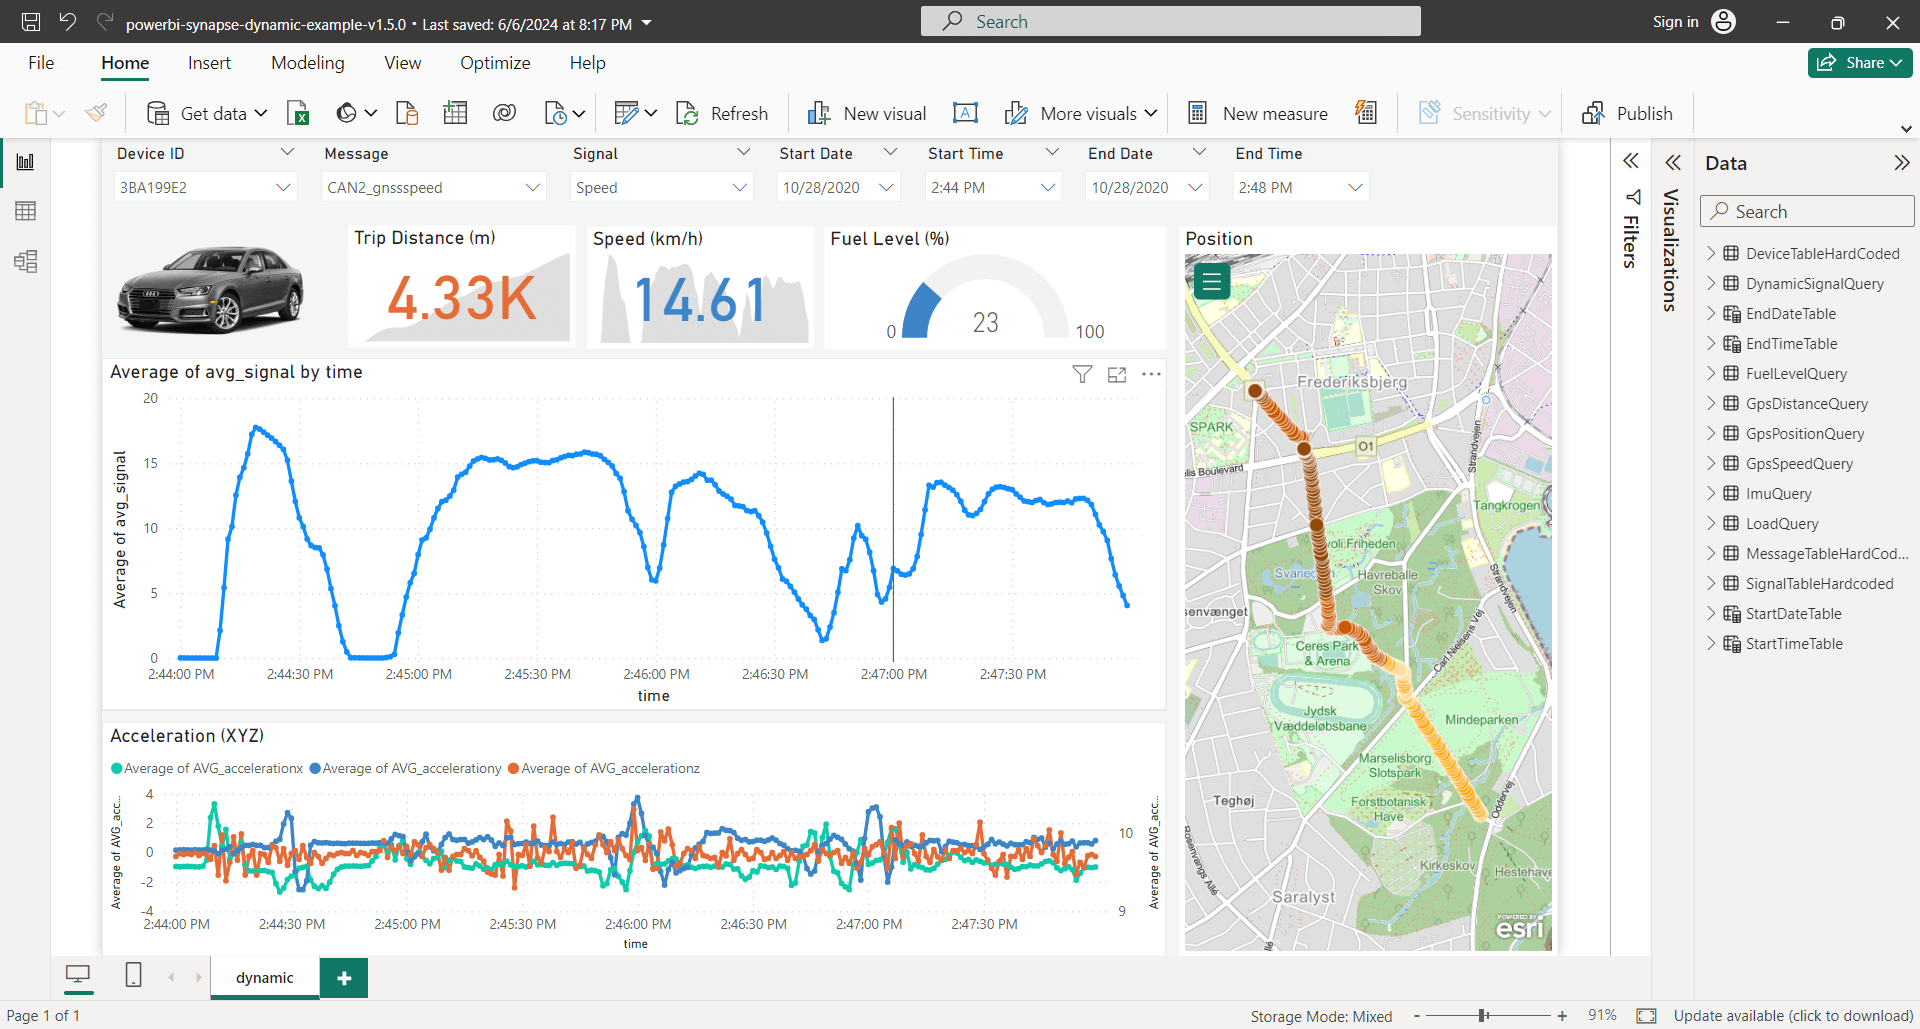
Create amazing CAN data reports
Visualize your DBC decoded vehicle/machine data via graphs, GPS maps, gauges, tables, KPIs, histograms, pies and more.
Customize your Power BI dashboard
Use Power Query to create separate serverless Synapse queries, without loading the underlying data into your report. Use Parameters for creating dynamic and efficient queries.
Make your reports interactive
Leverage Power BI functionality like slicers and filters to enable end users to interact with your data lake. Directly bind slicers to your SQL query Parameters.
Create Azure-native vehicle fleet reports
Need to create dashboard/report across your vehicle fleet?
You can deploy the CANedge2 or CANedge3 in a vehicle fleet to collect CAN/LIN data to your own Azure Blob Storage container via WiFi or 3G/4G. Uploaded raw data can be automatically DBC decoded via Azure Functions using your DBC files stored in the input container. The decoded data is written to your Data Lake Gen2 output container in the form of a Parquet data lake. Using Power BI, you can create custom reports and dashboards to visualize and share the decoded data across your organisation.


Visualize CAN bus data from your CANedge1
Need to visualize data recorded offline by your CANedge1?
PowerBI-Synapse can also be used if you are recording offline via the CANedge1. Our Python scripts lets you DBC decode and upload a backlog of data from local disk to your Azure data lake. By following the PowerBI-Synapse guide, you will set up an output container for storing your Parquet data lake in a few clicks - and make it accessible for visualization in Power BI.
Build white label fleet management platform
Need to create an targeted dashboard solution for your customers?
The CANedge is designed for white labeling by OEMs and system integrators. Add your own logo and use our software/APIs to deploy your own solutions to specific target audiences - e.g. for predictive maintenance, marine telematics, heavy-duty fleet management or OBD2 car telematics. Here, PowerBI-Synapse makes it easy to deploy custom reports for specific use cases or clients.


Democratize your data lake via Synapse SQL
Need to broaden access to your Parquet data lake?
Importantly, deploying an Azure Parquet data lake with Synapse not only enables Power BI or Grafana dashboard visualization. More generally, Synapse provides a standard SQL interface to your entire Parquet data lake - enabling a far wider audience in your organization to work with your vehicle/machine fleet data. For example, your team can perform SQL queries directly in Synapse - or use e.g. Python to quickly perform scripted data extraction at scale. In particular, Synapse eliminates the significant complexity that is normally encountered when extracting data from 'beyond-memory' datasets (e.g. 1 TB of data) - returning just the insights you want via SQL.
Ready to visualize your CAN data?
Get your CANedge today!


